Draw a grid of SNFG glycan cartoons
Usage
draw_cartoons(
  structure,
  ...,
  show_linkage = TRUE,
  orient = c("left", "right", "up", "down"),
  highlight = NULL,
  style = style_glydraw(),
  red_end = NULL,
  nrow = NULL,
  ncol = NULL,
  max_n = 36
)
Arguments
- structure
A
glyrepr::glycan_structure()vector or a character vector of glycan structure strings supported byglyparse::auto_parse().- ...
Must be empty. Unused arguments raise an error.
- show_linkage
Show glycosidic linkage annotations or not. Default is TRUE. Substituent annotations are always shown.
- orient
Direction in which the glycan extends from its reducing end: one of
"left","right","up", or"down". Defaults to"left".- highlight
An integer vector specifying the node indices to highlight. This argument is applicable only when
structureis aglyrepr::glycan_structure(). Note that for aglyrepr::glycan_structure(), the node indices correspond exactly to the monosaccharides in its printed IUPAC nomenclature. For example, givenglyrepr::as_glycan_structure("Gal(b1-3)[GlcNAc(b1-6)]GalNAc(a1-"), settinghighlight = c(1, 3)will highlight the "Gal" and "GalNAc" nodes.- style
A
style_glydraw()object that controls the cartoon's visual appearance.- red_end
Reducing-end annotation.
NULL, the default, usesred_endfromstyle. A non-NULLvalue overridesstyle$red_end. Ignored whenstyle$red_end_lengthis0or the glycan is an alditol. To annotate an amino-acid sequence, tag its single glycosite as, for example,"ABC<site>D</site>EFG".- nrow, ncol
Positive integer numbers of rows and columns. When both are
NULL, the number of columns isceiling(sqrt(length(structure)))and the number of rows is calculated to fit all structures. When only one is supplied, the other is calculated automatically.- max_n
Maximum permitted input length, a positive integer. Defaults to 36. Longer inputs produce an error rather than being truncated.
Value
A ggplot2 object of class glydraw_cartoon, which can be saved
with save_cartoon().
Details
Cartoons fill the grid from left to right, then top to bottom, preserving
input order and duplicates. Unused cells are blank. All cells have the same
size, large enough for the largest cartoon, and residue sizes are consistent
across cells. Drawing arguments are applied to every glycan; in particular,
highlight uses the same node indices for each structure.
Examples
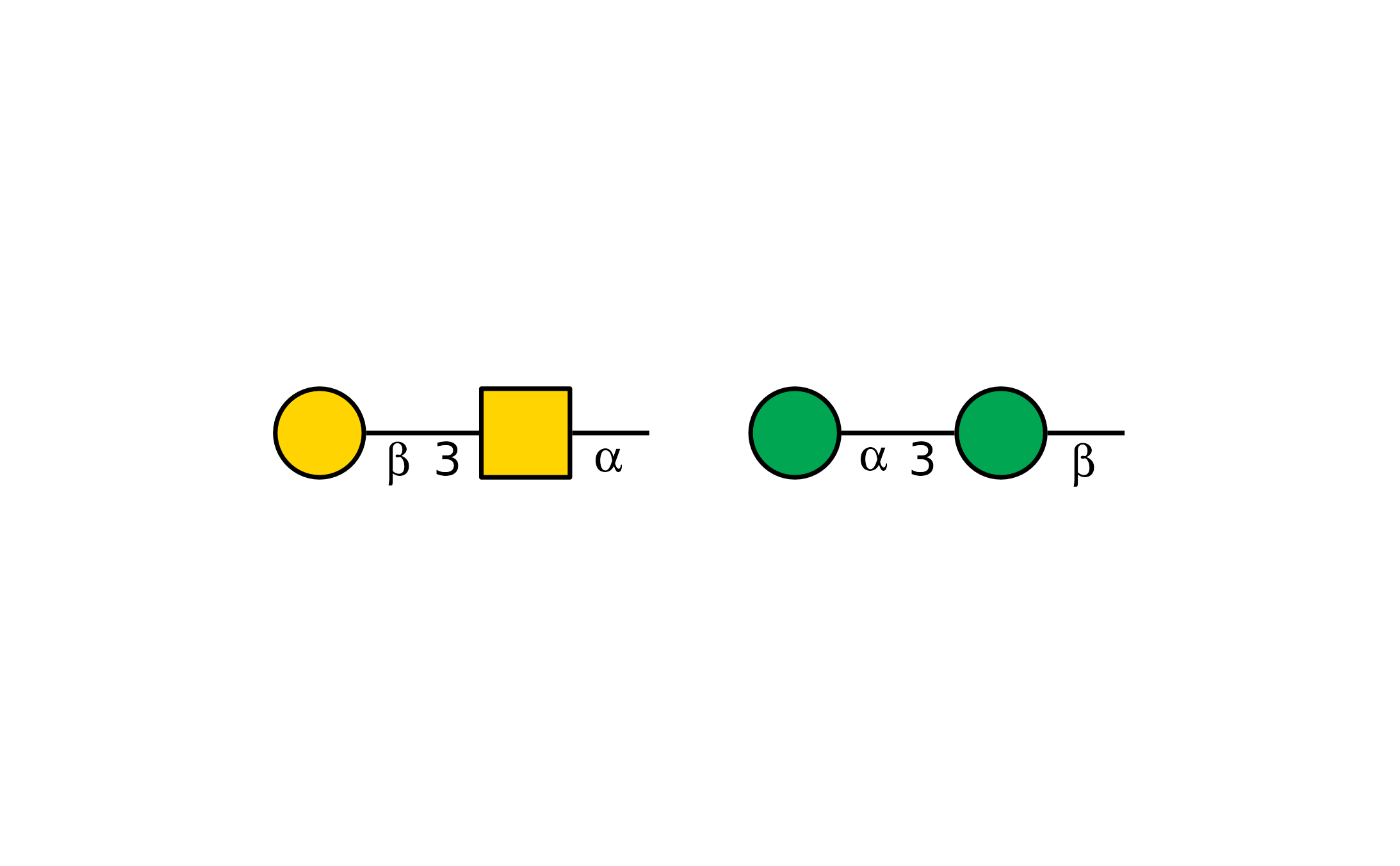
draw_cartoons(c("Gal(b1-3)GalNAc(a1-", "Man(a1-3)Man(b1-"))