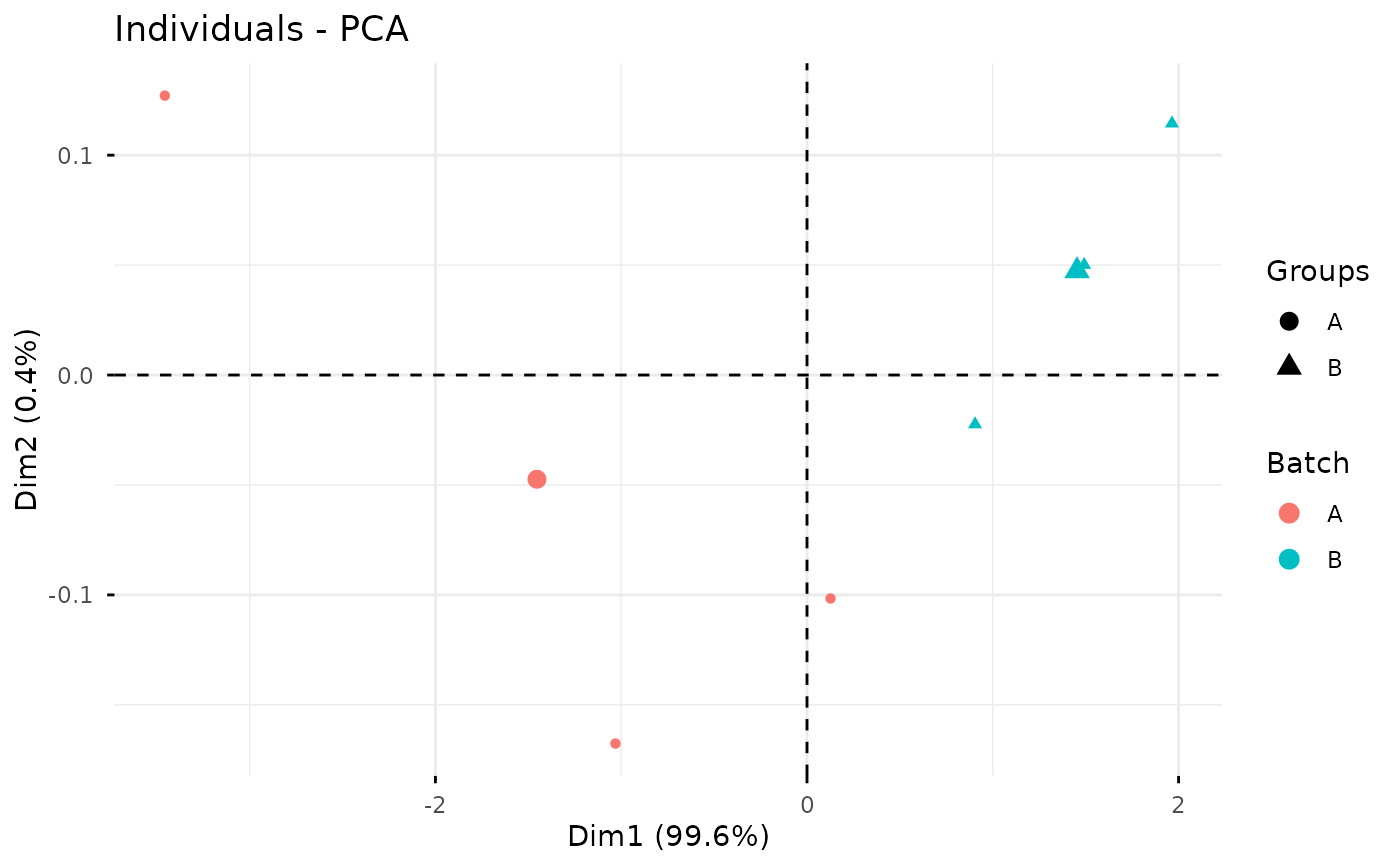
Plot PCA Score by Batch
plot_batch_pca.RdDraw a PCA score plot for samples and color points by batch. PCA is computed on log2-transformed intensities after removing variables with missing values.
Arguments
- exp
A
glyexp::experiment()object.- batch_col
Column name in
sample_info, or a factor/vector with length equal to the number of samples.
Examples
exp <- glyexp::toy_experiment
exp$sample_info$batch <- rep(c("A", "B"), each = 3)
plot_batch_pca(exp, batch_col = "batch")