Plot CV Density
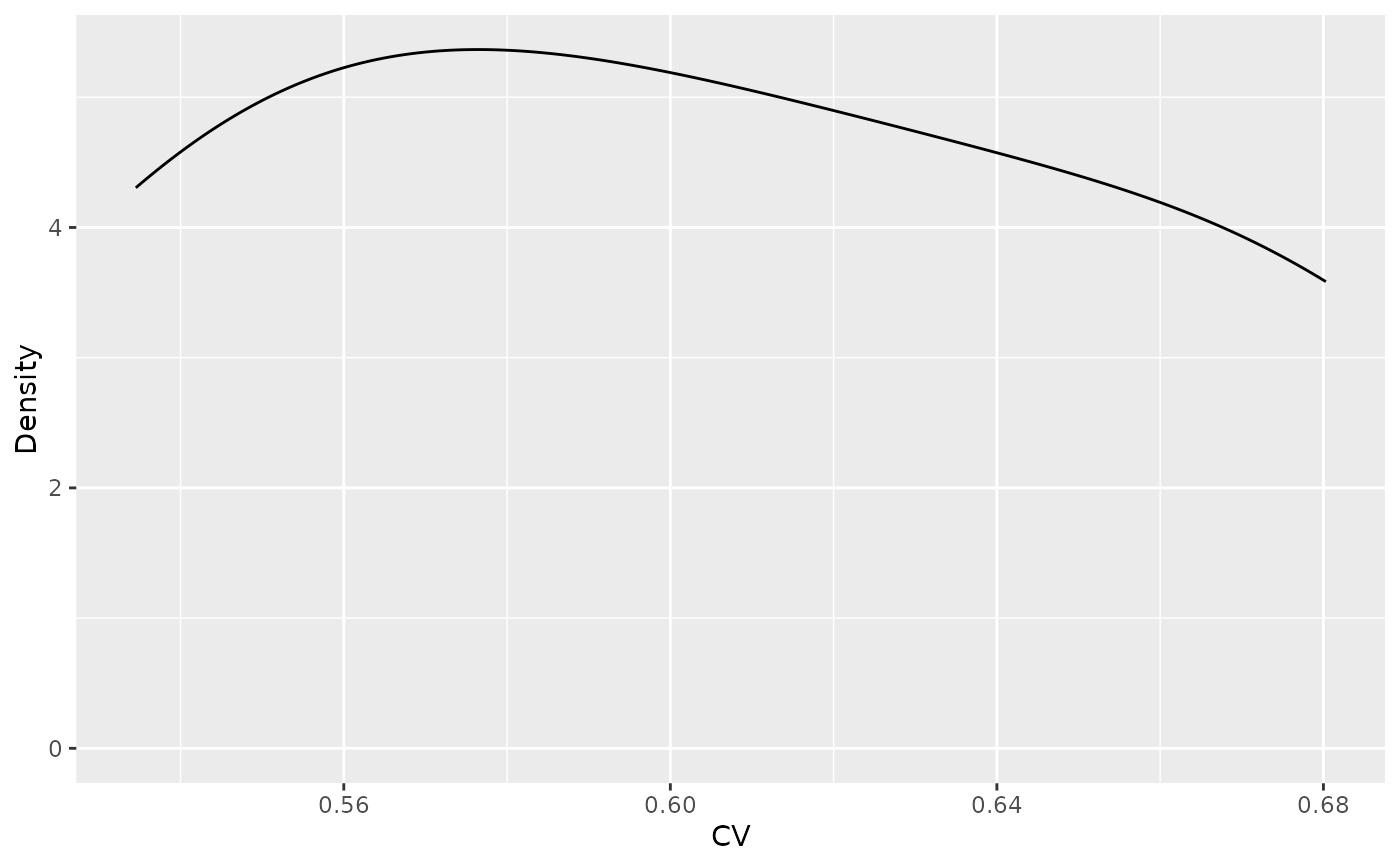
plot_cv_dent.RdCompute coefficient of variation (CV) for each variable and plot its density.
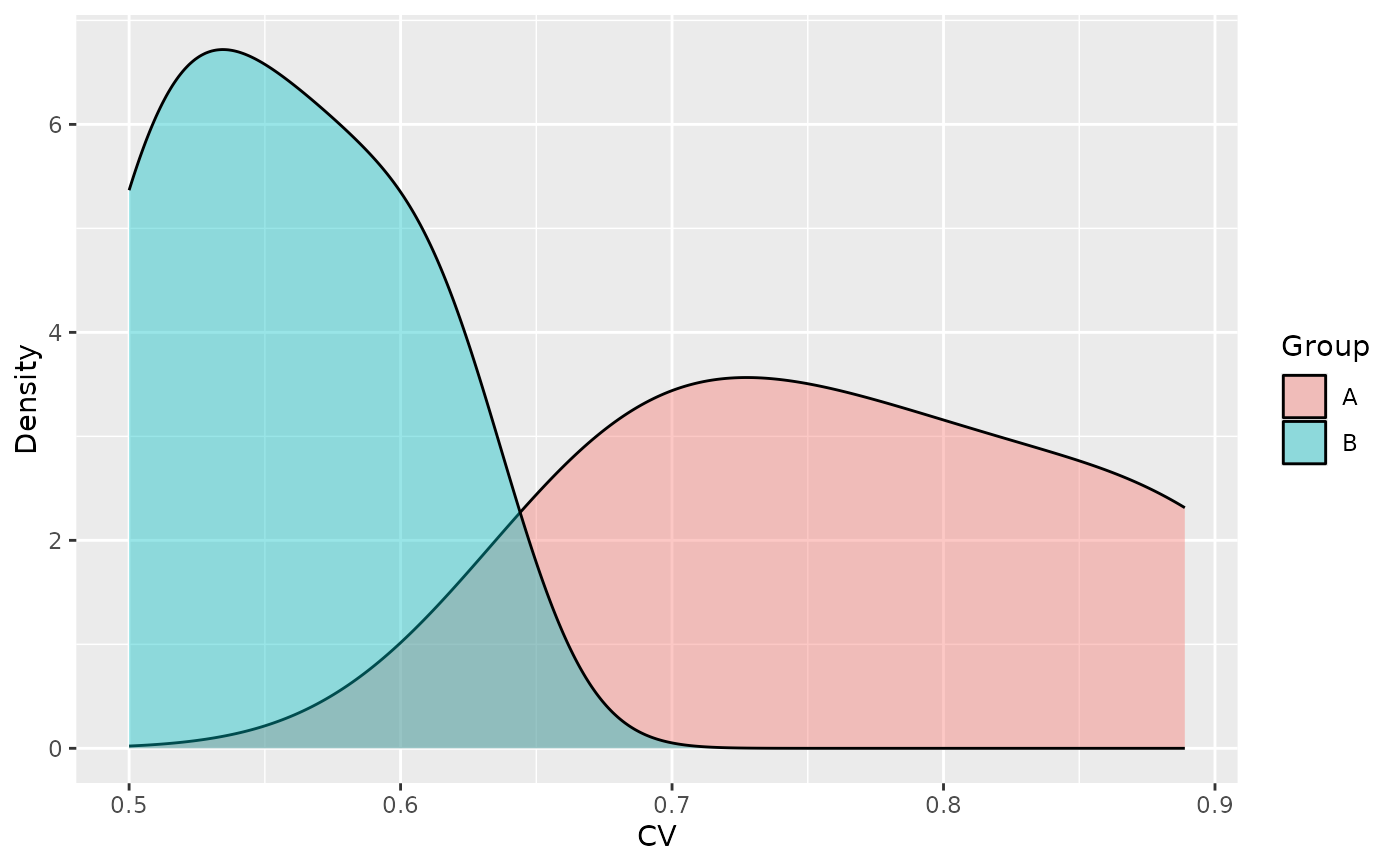
When by is provided, CVs are computed within each group and densities are
shown with different fills.
Arguments
- exp
A
glyexp::experiment()object.- by
Grouping variable for samples. Can be a column name in
sample_infoor a vector/factor with length equal to the number of samples. When provided, CVs are computed within each group and densities are shown with different fills.
Examples
plot_cv_dent(glyexp::toy_experiment)

exp <- glyexp::toy_experiment
exp$sample_info$group <- rep(c("A", "B"), length.out = ncol(exp$expr_mat))
plot_cv_dent(exp, by = "group")
exp <- glyexp::toy_experiment
exp$sample_info$group <- rep(c("A", "B"), length.out = ncol(exp$expr_mat))
plot_cv_dent(exp, by = "group")