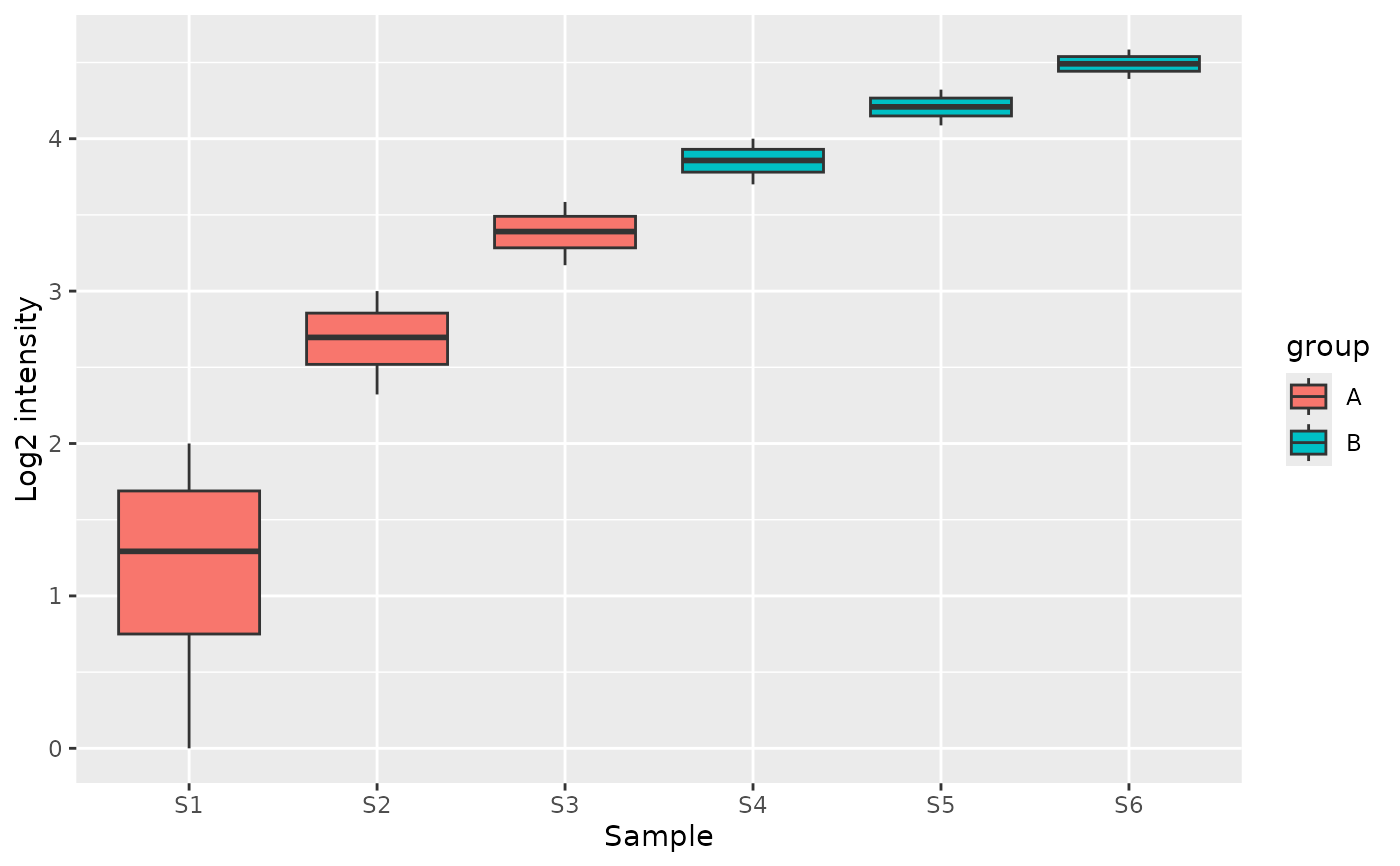
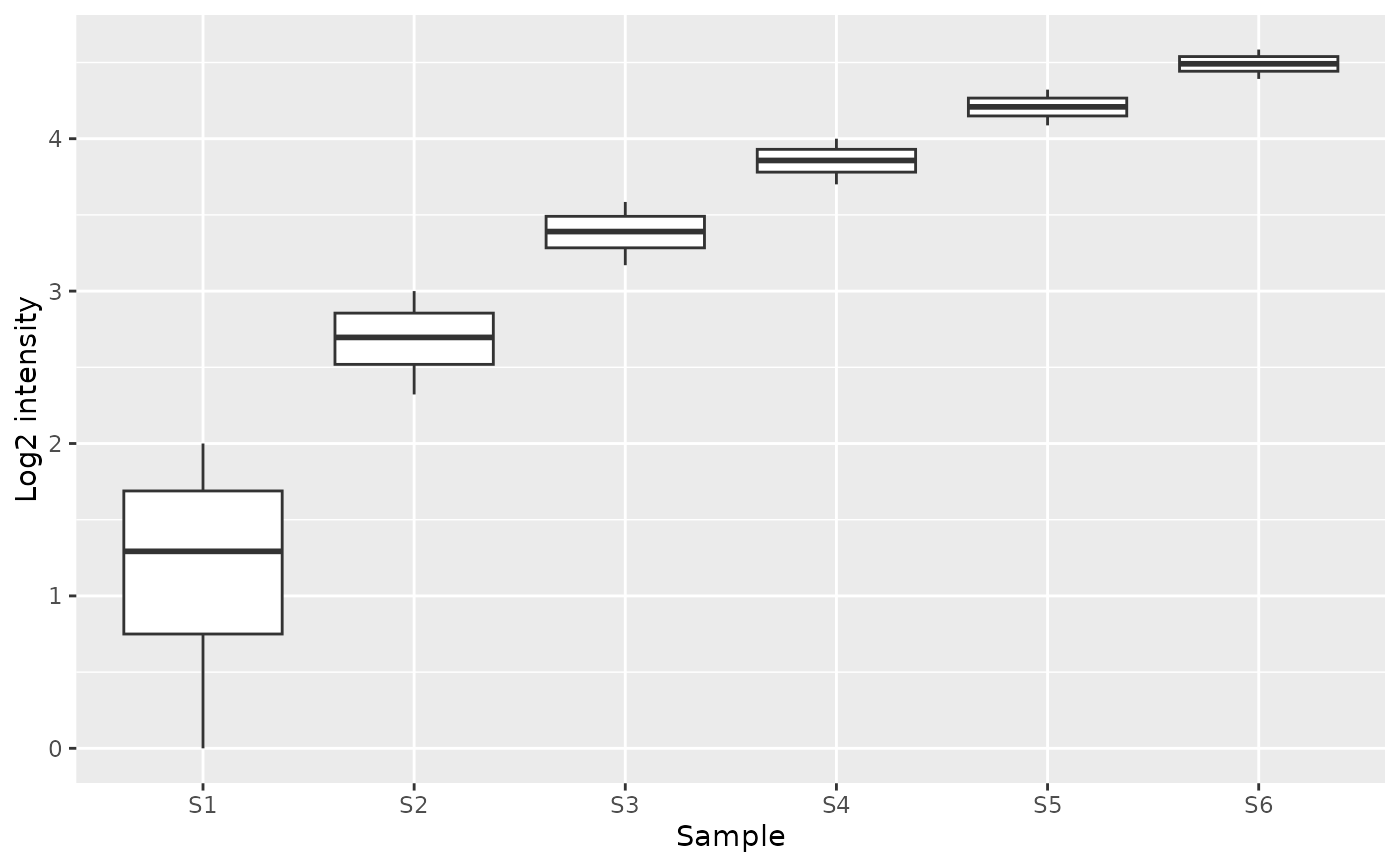
Plot Log-Intensity Boxplots by Sample
plot_int_boxplot.RdDraw boxplots of log2-transformed intensities for each sample. Optionally color and group samples by a metadata variable.
Arguments
- exp
A
glyexp::experiment()object.- by
Grouping variable for samples. Can be a column name in
sample_infoor a vector/factor with length equal to the number of samples. When provided, samples are grouped along the x-axis and boxplots are colored by group.
Examples
plot_int_boxplot(glyexp::toy_experiment)

plot_int_boxplot(glyexp::toy_experiment, by = "group")