Plot Missing Value Heatmap
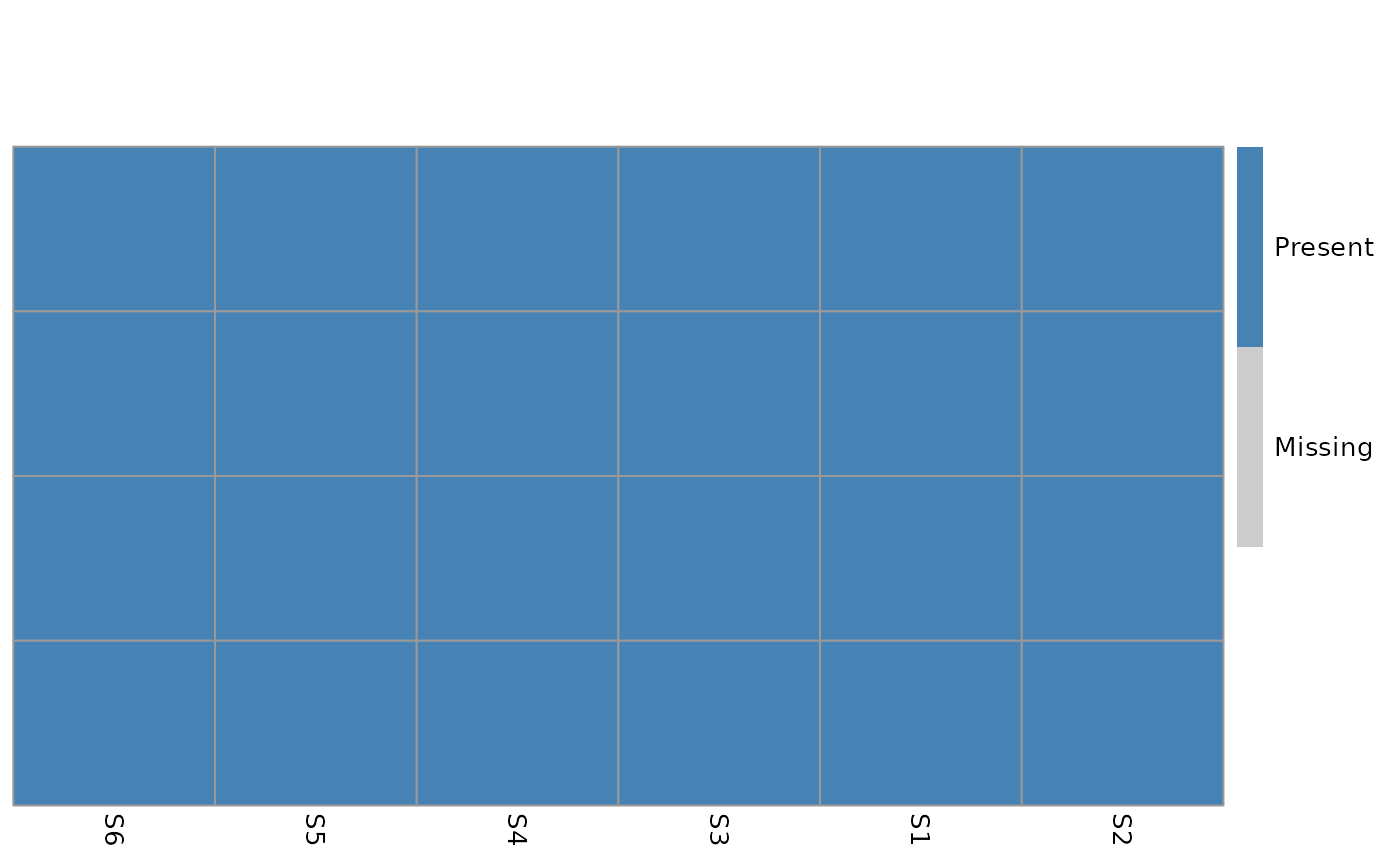
plot_missing_heatmap.RdDraw a binary heatmap showing the missing value pattern in an experiment. Values are binarized: 1 (present) or 0 (missing). Rows (variables) are sorted by missing value proportion from low to high. Columns (samples) are clustered using hierarchical clustering.
Arguments
- exp
A
glyexp::experiment()object.- ...
Other arguments passed to
pheatmap::pheatmap().
Examples
plot_missing_heatmap(glyexp::toy_experiment)