Plot Rank Abundance
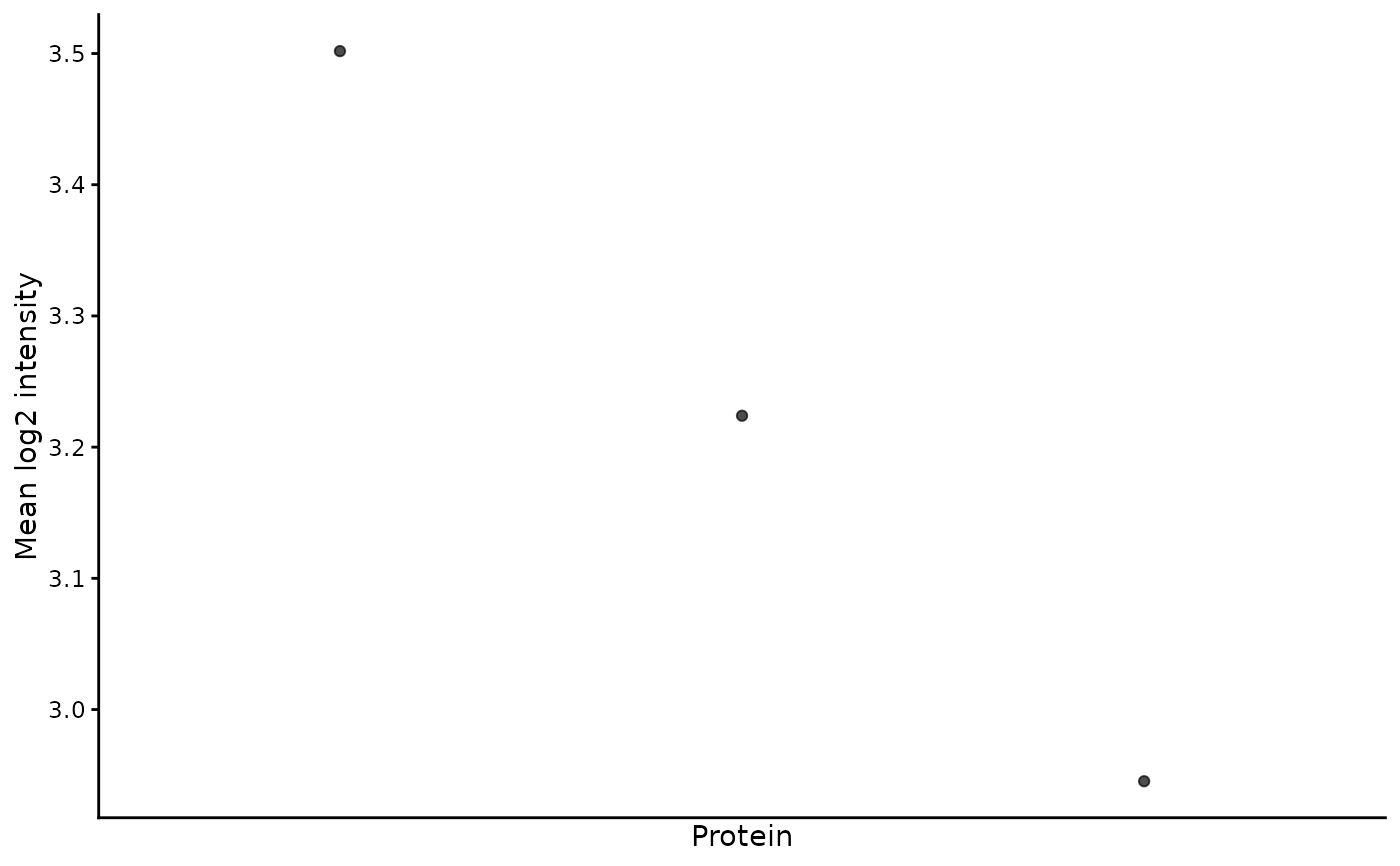
plot_rank_abundance.RdDraw a scatter plot of proteins ranked by mean log2 intensity. Proteins are ordered from high to low mean intensity along the x-axis.
Arguments
- exp
A
glyexp::experiment()object.
Examples
plot_rank_abundance(glyexp::toy_experiment)