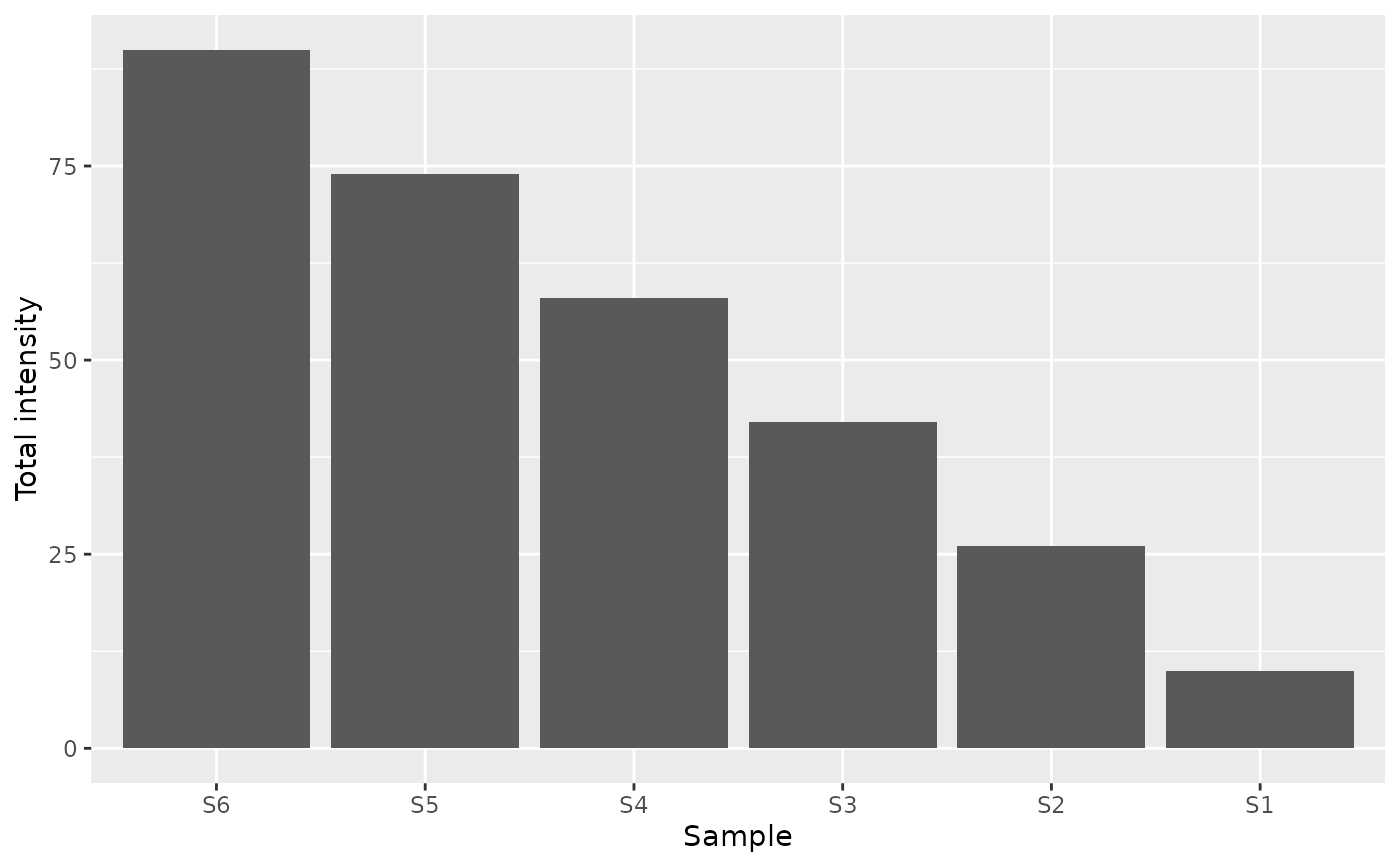
Plot Total Intensity by Sample
plot_tic_bar.RdDraw a bar plot showing total intensity (TIC) for each sample. Samples are ordered from high to low TIC from left to right.
Arguments
- exp
A
glyexp::experiment()object.
Examples
plot_tic_bar(glyexp::toy_experiment)