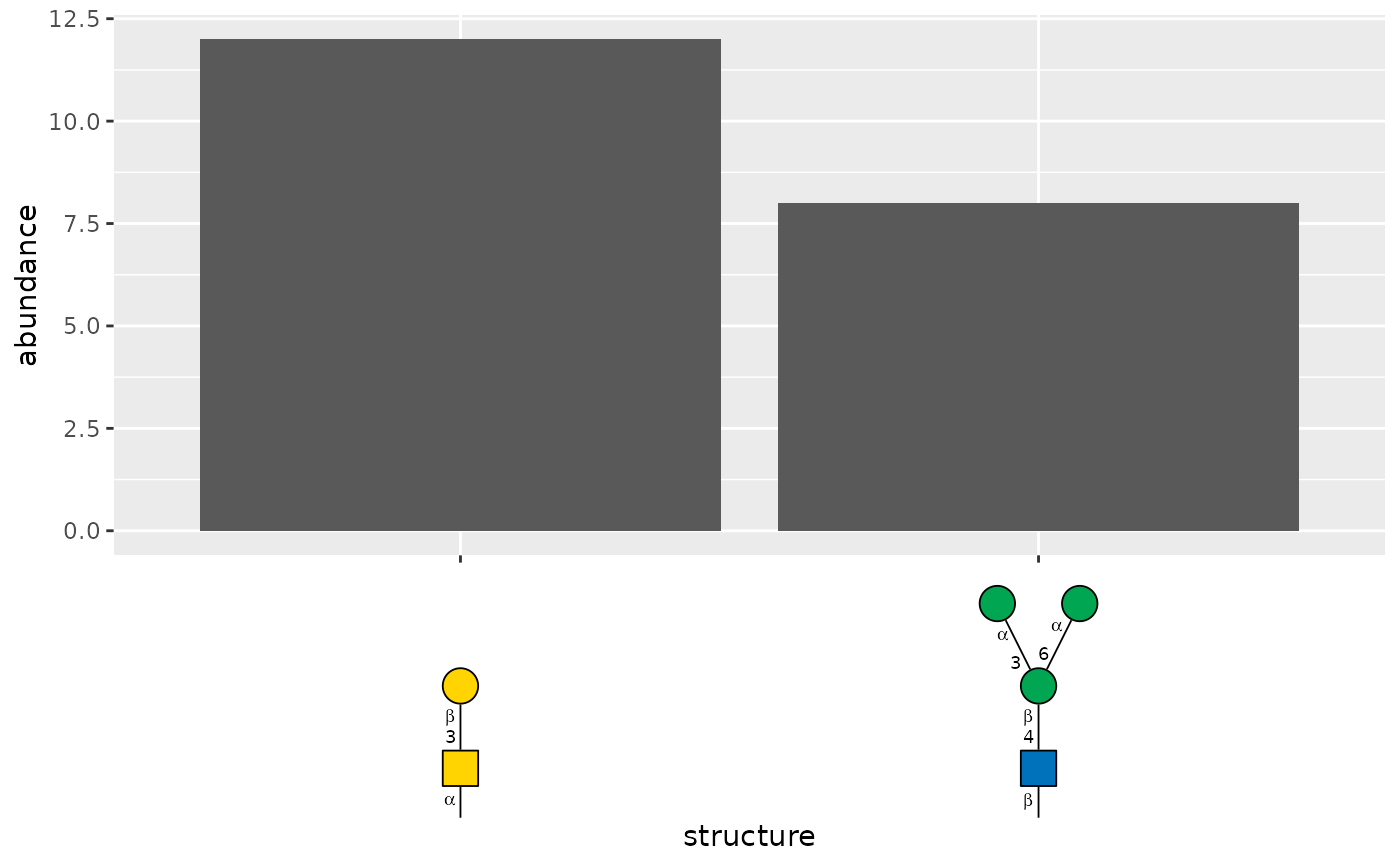
scale_x_glycan() and scale_y_glycan() are discrete position scales that
replace text tick labels with compact glycan cartoons. Mapped discrete values
and values returned by the scale's labels argument may be glycan structure
strings supported by glyparse::auto_parse() or
glyrepr::glycan_structure() vectors. X-axis cartoons are vertical and
bottom-aligned by default, while y-axis cartoons are horizontal and
right-aligned by default. The cartoon orientation and alignment adapt to the
displayed axis, including when the axes are swapped by
ggplot2::coord_flip().
Usage
scale_x_glycan(
  name = ggplot2::waiver(),
  ...,
  palette = seq_len,
  expand = ggplot2::waiver(),
  position = "bottom",
  sec.axis = ggplot2::waiver(),
  continuous.limits = NULL,
  size = 0.4,
  angle = 0,
  hjust = hjust_red_end(),
  vjust = 0,
  nudge_x = 0,
  nudge_y = 0,
  show_linkage = TRUE,
  style = style_glydraw(),
  red_end = NULL,
  orient = NULL
)

scale_y_glycan(
  name = ggplot2::waiver(),
  ...,
  palette = seq_len,
  expand = ggplot2::waiver(),
  position = "left",
  sec.axis = ggplot2::waiver(),
  continuous.limits = NULL,
  size = 0.4,
  angle = 0,
  hjust = 1,
  vjust = vjust_red_end(),
  nudge_x = 0,
  nudge_y = 0,
  show_linkage = TRUE,
  style = style_glydraw(),
  red_end = NULL,
  orient = NULL
)
Arguments
- name
The name of the scale, displayed as the axis title. Use
NULLto remove the title.- ...
Arguments passed to
ggplot2::scale_x_discrete()orggplot2::scale_y_discrete(), includingbreaksandlabels.- palette
A palette function that returns discrete position values.
- expand
Expansion applied to the discrete position scale.
- position
Position of the axis.
- sec.axis
A secondary axis specification.
- continuous.limits
Continuous limits used to position the discrete scale.
- size
Positive scalar that uniformly scales each axis-label cartoon. Defaults to
0.4.- angle
Rotation in degrees applied to each axis-label cartoon, independently of the cartoon orientation. Defaults to
0.- hjust
Horizontal justification. When omitted, cartoons on a top or bottom axis with a vertical orientation use
hjust_red_end(). Cartoons on a left or right axis with a horizontal orientation use1or0, respectively. Other position-orientation combinations use0.5.- vjust
Vertical justification. When omitted, cartoons on a top or bottom axis with a vertical orientation use
0. Cartoons on a left or right axis with a horizontal orientation usevjust_red_end(). Other position-orientation combinations use0.5.- nudge_x
Horizontal adjustment of each cartoon, in millimetres. Positive values move cartoons to the right. When this moves cartoons toward or away from a y-axis title, the title moves with them to preserve the gap. Defaults to
0.- nudge_y
Vertical adjustment of each cartoon, in millimetres. Positive values move cartoons upward. When this moves cartoons toward or away from an x-axis title, the title moves with them to preserve the gap. Defaults to
0.- show_linkage
Whether to show glycosidic linkage annotations inside the cartoons. Defaults to
TRUE.- style
A
style_glydraw()object that controls the cartoons' visual appearance.- red_end
Reducing-end annotation.
NULL, the default, usesred_endfromstyle. A non-NULLvalue overridesstyle$red_end.- orient
Glycan drawing orientation.
NULL, the default, selects the orientation from the displayed axis position:"up"for"bottom"or"top","left"for"left", and"right"for"right".